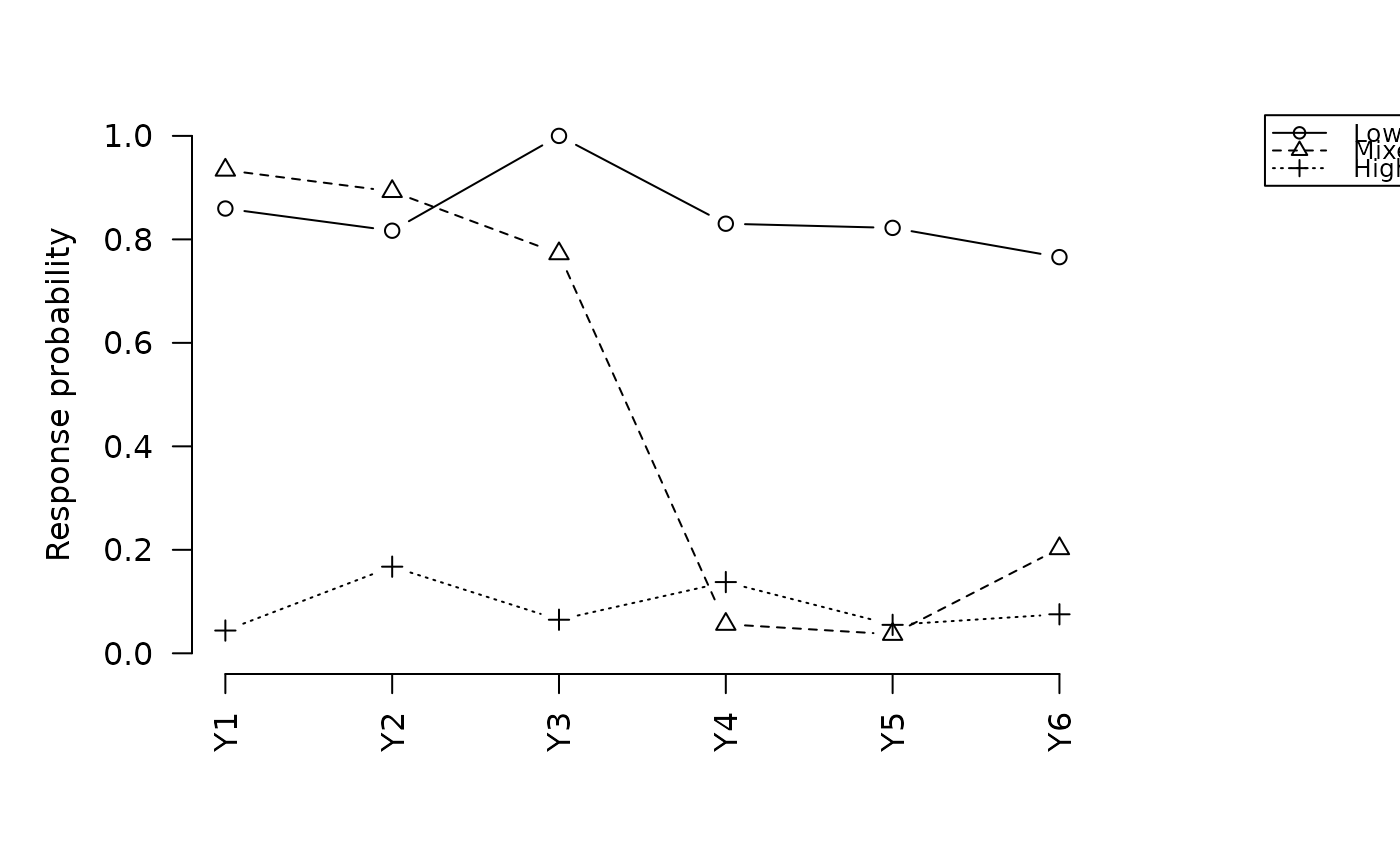
Plot item-response probability profiles for a tseLCA model
Source:R/methods-tseLCA.R
plot.tseLCA.RdDelegates to plot.multiLCA from multilevLCA, which draws the
class-specific item-response probability profiles of the Step-1
measurement model.
Usage
# S3 method for class 'tseLCA'
plot(x, horiz = FALSE, clab = NULL, ...)Examples
d <- generate_data(100, "high", "covariate", seed = 1)
fit_m <- three_step(d, paste0("Y", 1:6), n_classes = 3)
plot(fit_m)
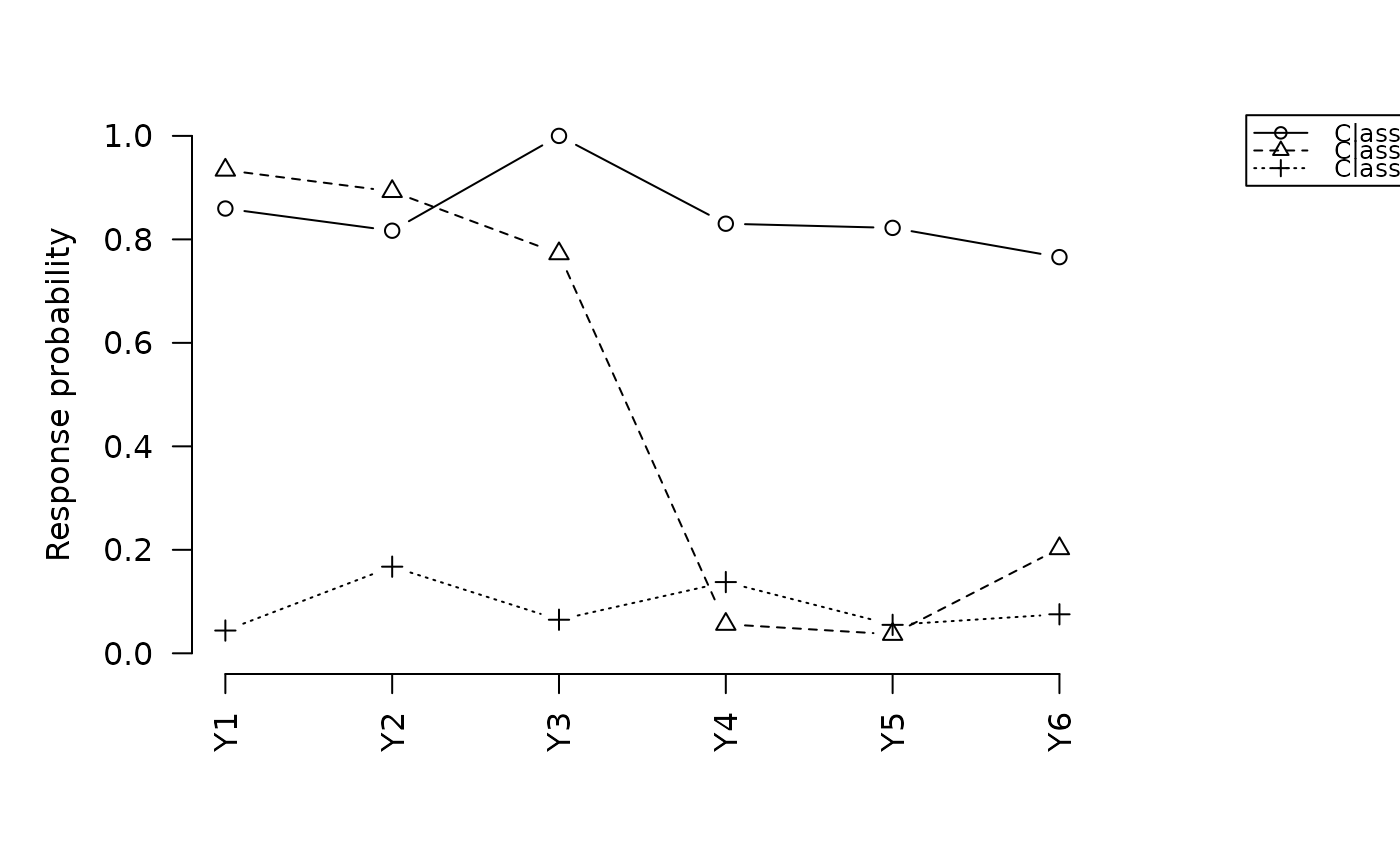 plot(fit_m, clab = c("Low", "Mixed", "High"))